


Posted on 26th September 2018 by Eveliina Ilola
What is standard deviation?
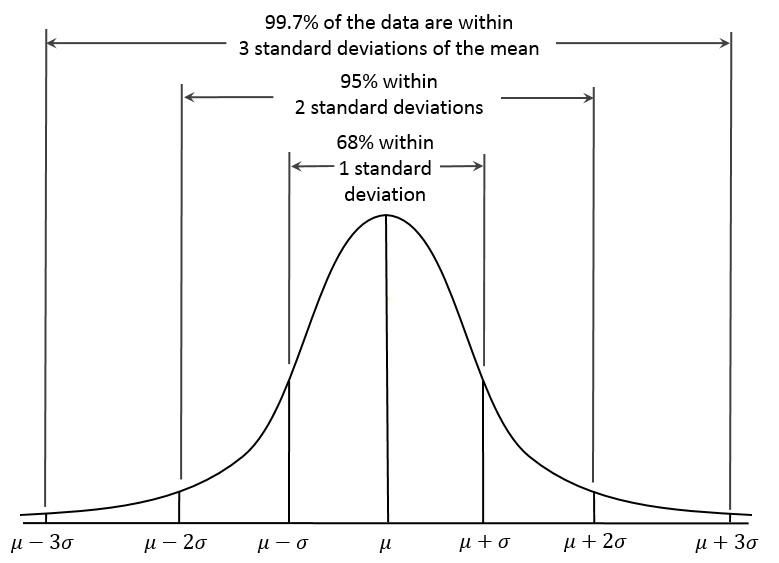
Standard deviation tells you how spread out the data is. It is a measure of how far each observed value is from the mean. In any distribution, about 95% of values will be within 2 standard deviations of the mean.
How to calculate standard deviation
Standard deviation is rarely calculated by hand. It can, however, be done using the formula below, where x represents a value in a data set, μ represents the mean of the data set and N represents the number of values in the data set.
The steps in calculating the standard deviation are as follows:
- For each value, find its distance to the mean
- For each value, find the square of this distance
- Find the sum of these squared values
- Divide the sum by the number of values in the data set
- Find the square root of this
What is standard error?
When you are conducting research, you often only collect data of a small sample of the whole population. Because of this, you are likely to end up with slightly different sets of values with slightly different means each time.
If you take enough samples from a population, the means will be arranged into a distribution around the true population mean. The standard deviation of this distribution, i.e. the standard deviation of sample means, is called the standard error.
The standard error tells you how accurate the mean of any given sample from that population is likely to be compared to the true population mean. When the standard error increases, i.e. the means are more spread out, it becomes more likely that any given mean is an inaccurate representation of the true population mean.
How to calculate standard error
Standard error can be calculated using the formula below, where σ represents standard deviation and n represents sample size.
Standard error increases when standard deviation, i.e. the variance of the population, increases. Standard error decreases when sample size increases - as the sample size gets closer to the true size of the population, the sample means cluster more and more around the true population mean.
Images:
Image 1: Dan Kernler via Wikipedia Commons: https://commons.wikimedia.org/wiki/File:Empirical_Rule.PNGÂ
Image 2: https://www.khanacademy.org/math/probability/data-distributions-a1/summarizing-spread-distributions/a/calculating-standard-deviation-step-by-step
Image 3: https://toptipbio.com/standard-error-formula/
Sources:
http://www.statisticshowto.com/probability-and-statistics/standard-deviation/
http://www.statisticshowto.com/what-is-the-standard-error-of-a-sample/
https://www.statsdirect.co.uk/help/basic_descriptive_statistics/standard_deviation.htm
https://www.bmj.com/about-bmj/resources-readers/publications/statistics-square-one/2-mean-and-standard-deviation
